Creating charts and graphs in WordPress can elevate the visual appeal and effectiveness of your website’s content. With the Chartify plugin, integrating various types of charts and graphs into your WordPress site becomes a seamless experience. This tutorial will guide you through the process of using Chartify to create dynamic and interactive charts and graphs, enhancing your site’s data presentation.
Prerequisites
Please make sure you have the following installed and activated:
- Chartify (Pro Version optional)
Additional knowledge
Chartify is a versatile WordPress plugin that offers a wide range of chart types and customization options. It supports data import from various sources, including manual entry, CSV files, and Google Sheets. Understanding basic WordPress operations and familiarity with data visualization concepts will help in effectively utilizing Chartify.
Instructions for WordPress Charts and Graphs with Chartify
- Navigate to Plugins > Add New Plugin, search for “Chartify”, click on “Install Now”, then activate the plugin.

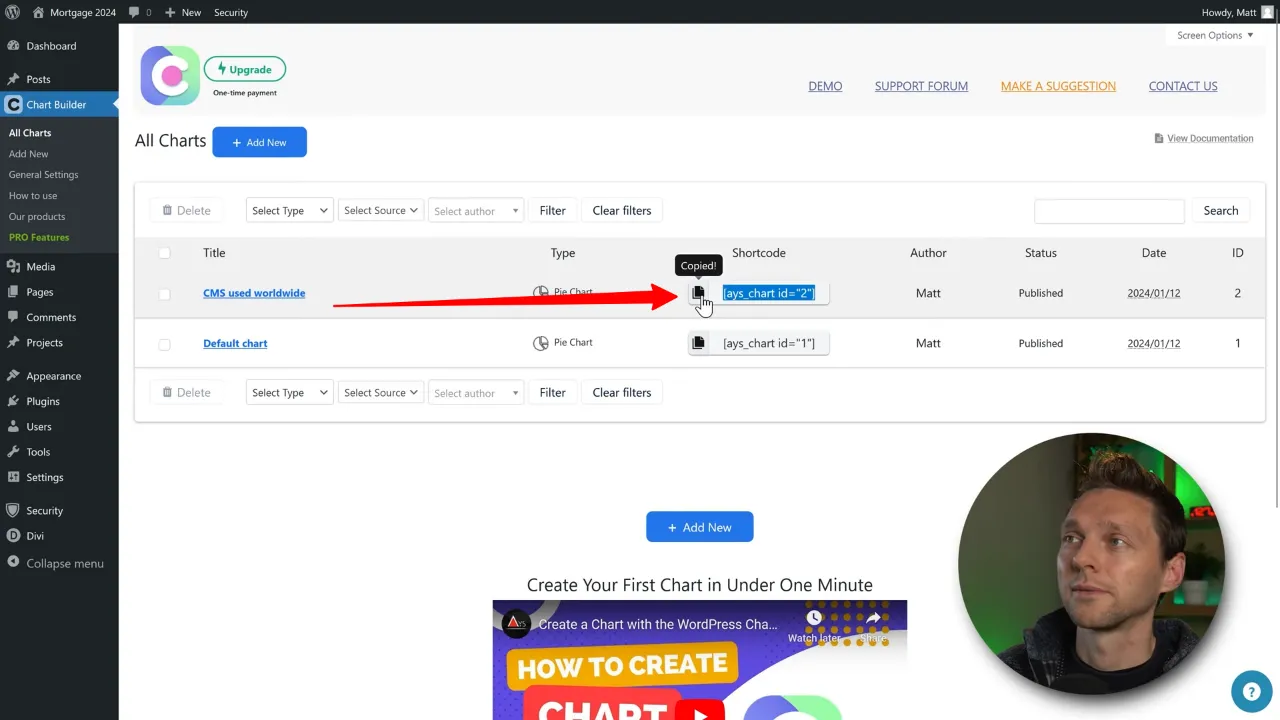
- Access the Chartify interface by clicking on Chart Builder > All Charts in the WordPress menu.

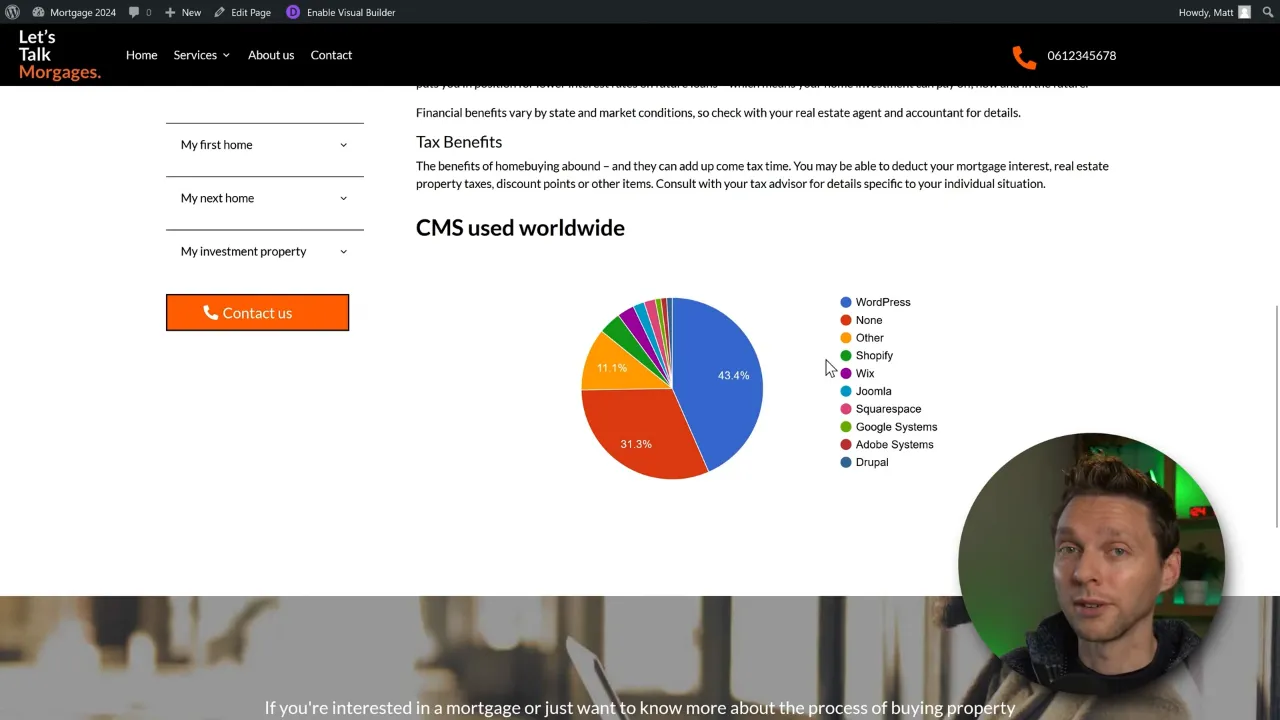
- Create a new chart by clicking “Add New”, choose a chart type (e.g., Pie Chart), and click “Next”.

- Enter a title for your chart and add data manually or import from a file or Google Sheets (Pro version required).

- Customize the chart settings, such as source, appearance, and interactivity.

- Preview the chart by clicking on “Show on Chart”.
- Save the chart and copy the shortcode provided.
- Embed the chart in your WordPress content using the shortcode in a text module or Gutenberg block.

Tip: Experiment with different chart types and settings to find the best visual representation for your data.
Official Documentation
WordPress Charts and Graphs with Chartify – Conclusion
Chartify offers a straightforward way to create visually appealing and interactive charts and graphs in WordPress. Whether you’re presenting simple data sets or complex analytics, Chartify’s wide range of chart types and customization options makes it a valuable tool for enhancing your website’s data visualization capabilities.
